Download RAMMap — Physical Memory Analyzer
See exactly how Windows allocates your RAM. Analyze file caches, kernel memory, and driver usage with this free portable tool from Microsoft Sysinternals.
Download RAMMap
Get the latest version of RAMMap directly from the official Microsoft Sysinternals source. No installation required — just extract and run.
Portable application — no installer needed. Extract the ZIP and run RAMMap.exe.
Sysinternals Suite
Get RAMMap bundled with 70+ other Sysinternals tools in a single download.
Download SuiteMicrosoft Store
Install the full Sysinternals Suite from the Microsoft Store with auto-updates.
View in StoreSysinternals Live
Run RAMMap directly from the web without downloading. Access via live.sysinternals.com.
Run LiveNeed help getting started? Check our step-by-step guide for setup instructions and tips.
What Is RAMMap?
A detailed look at the physical memory analysis tool built by Microsoft Sysinternals
Physical Memory, Made Visible
RAMMap is a free portable utility from Microsoft Sysinternals that shows you exactly how Windows assigns physical memory. Unlike Task Manager, which only reports working set sizes, RAMMap breaks down memory allocation by type — process private bytes, mapped files, metafile data, paged and nonpaged pool, kernel stacks, and more. Written by Mark Russinovich, the tool gives system administrators and developers a way to answer the question where is my RAM actually going?
The RAMMap download comes as a lightweight 706 KB ZIP file. There is no installer. Extract the archive, run the executable, and the tool loads a snapshot of your system’s physical memory on the spot. It works on Windows Vista through Windows 11, plus Windows Server 2008 and newer, making it practical for both desktop troubleshooting and server diagnostics.
How It Organizes Memory Data
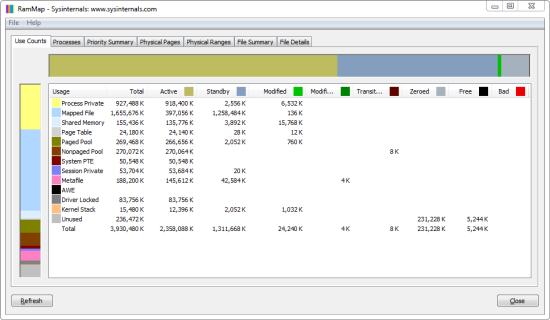
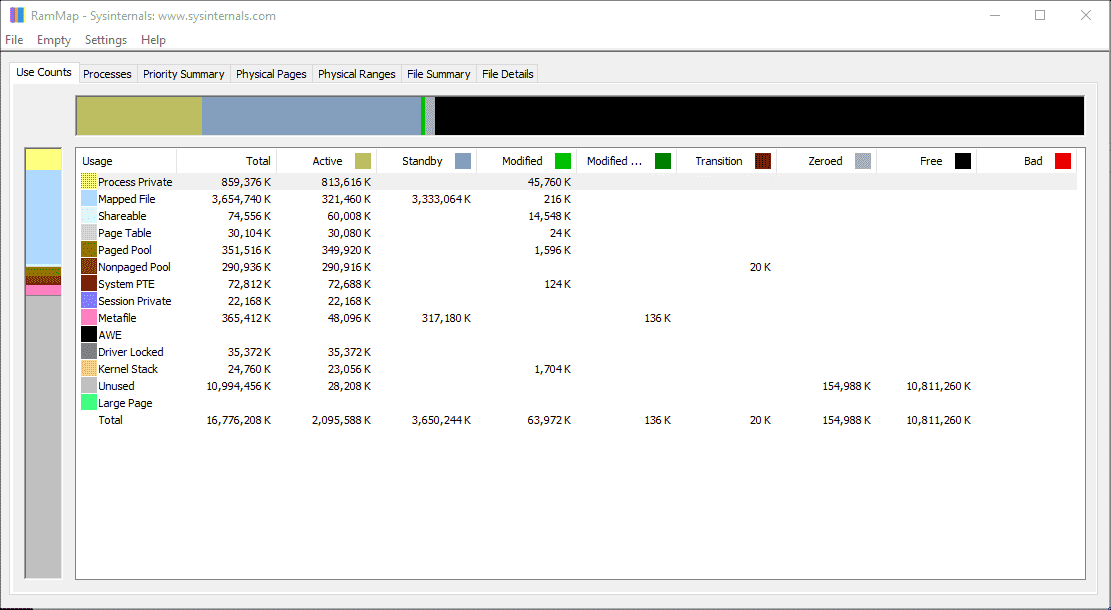
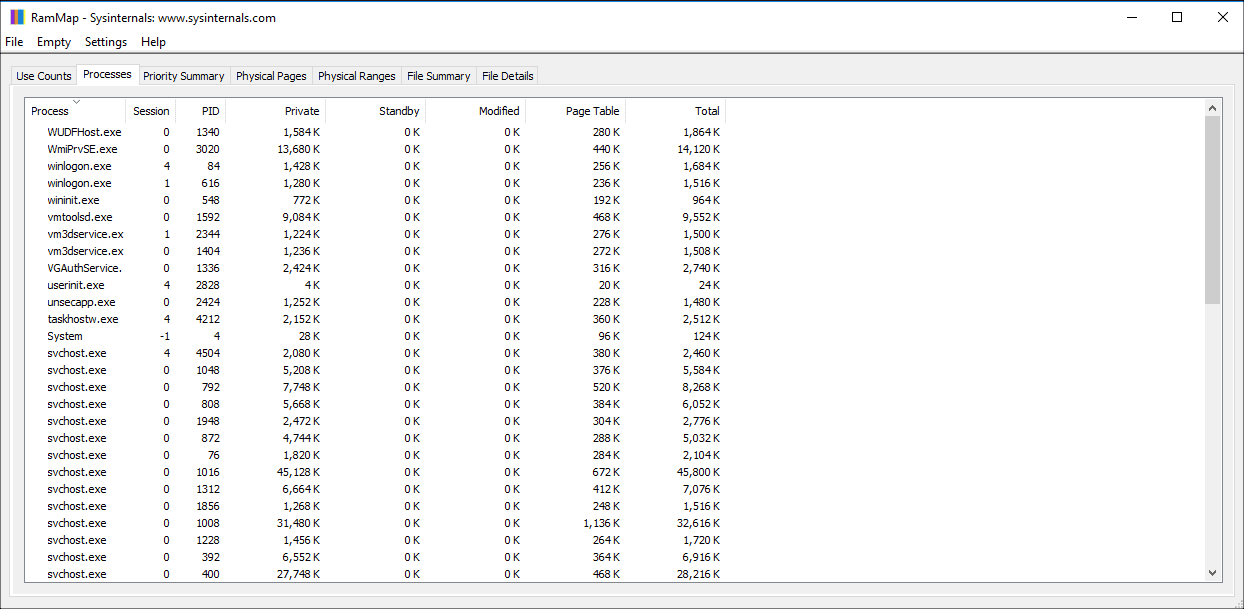
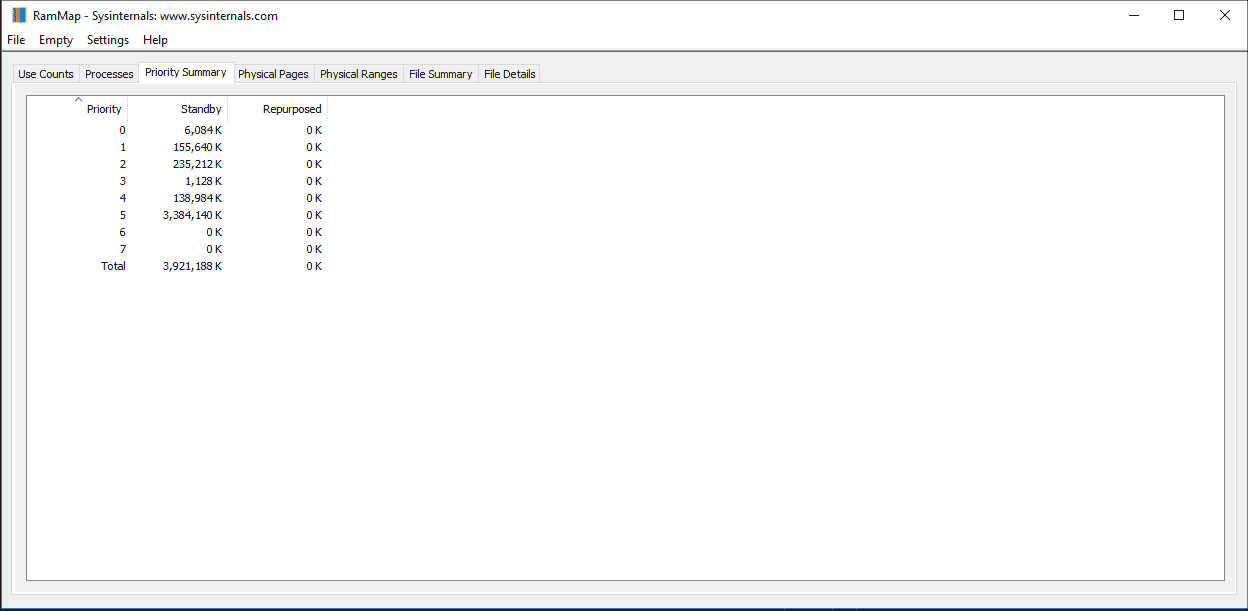
RAMMap presents information across seven tabs. The Use Counts tab gives you an overall summary of active, standby, modified, and zeroed pages by category. Processes lists working set sizes per process. Priority Summary shows how Windows has prioritized standby pages across eight priority levels. The Physical Pages and Physical Ranges tabs let you inspect individual 4 KB pages and contiguous address ranges, while File Summary and File Details reveal which files are cached in RAM and how much space they occupy.
Color-coded bars in each view make it easy to spot where memory pressure comes from. Green represents active pages, blue marks standby data, yellow highlights modified pages waiting to be written, and red flags zeroed or bad memory.
Who Benefits from RAMMap
System administrators use RAMMap to diagnose machines where available memory keeps shrinking even though no single process looks responsible. Developers rely on it to verify that their applications release file mappings properly. Power users turn to it when they want to clear the standby list manually through the Empty menu — a quick way to reclaim cached memory without rebooting. Because RAMMap runs as a portable app, it fits on a USB drive alongside other Sysinternals tools like Process Explorer and Process Monitor.
Ready to see where your RAM goes? Download RAMMap and start analyzing.
System Requirements
RAMMap is a lightweight portable utility that runs on most Windows systems without installation. Here is what you need.
| Component | Minimum | Recommended |
|---|---|---|
| Operating System | Windows Vista (32-bit or 64-bit) | Windows 10 or Windows 11 |
| Server OS | Windows Server 2008 | Windows Server 2019 or later |
| Processor | 1 GHz single-core (x86 or x64) | 2 GHz dual-core or faster |
| RAM | 512 MB | 4 GB or more |
| Disk Space | 2 MB free space | 10 MB (with snapshot storage) |
| Display | 1024 x 768 resolution | 1920 x 1080 or higher |
| Privileges | Administrator rights required | Administrator rights required |
| Internet | Not required | Not required (offline tool) |
Ready to get started? Download RAMMap — it takes under 5 seconds.
Key Features
RAMMap gives you a detailed look at how Windows uses physical memory, broken down by type, process, priority, and individual pages.
Use Counts Breakdown
The Use Counts tab shows a high-level summary of physical RAM allocation. You can see how much memory goes to process private data, mapped files, the metafile cache, page tables, and more — all in one table.
Per-Process Memory View
The Processes tab lists every running process alongside its working set size. This helps you spot which applications are consuming the most physical memory at any given moment.
Priority Summary
Windows assigns standby pages a priority from 0 to 7. RAMMap’s Priority Summary tab lets you see how much standby memory sits at each level, which is useful for diagnosing cache pressure problems.
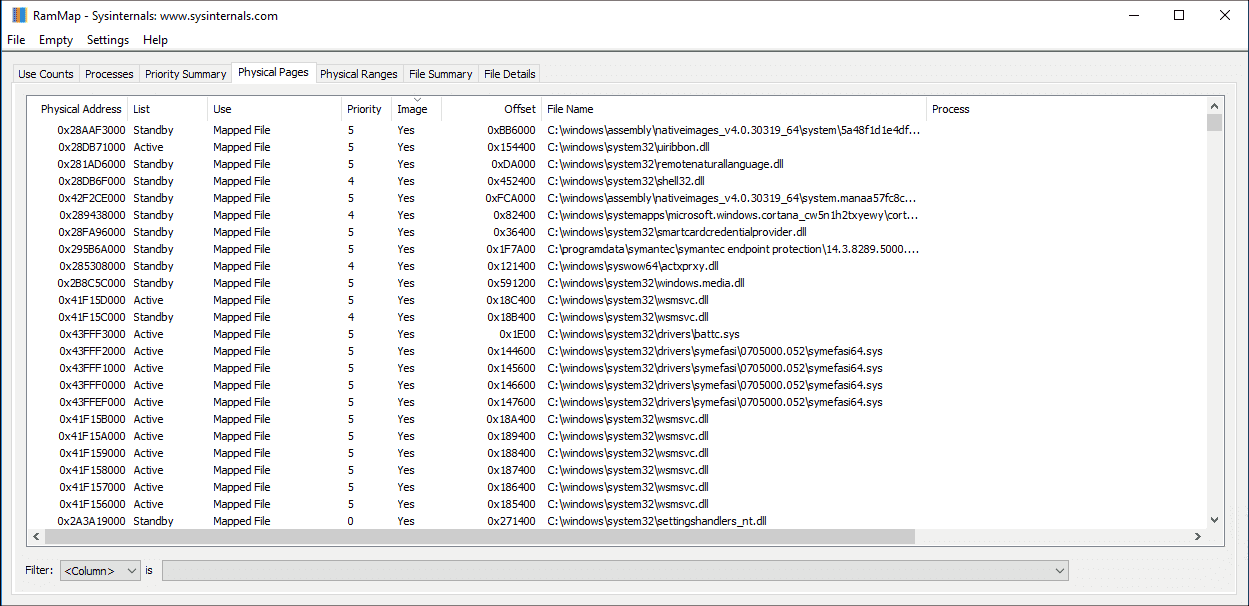
Physical Pages Map
View every individual physical page in your system. The Physical Pages tab displays each page’s status (Active, Standby, Modified, or Zeroed) with color-coded indicators across the entire address range.
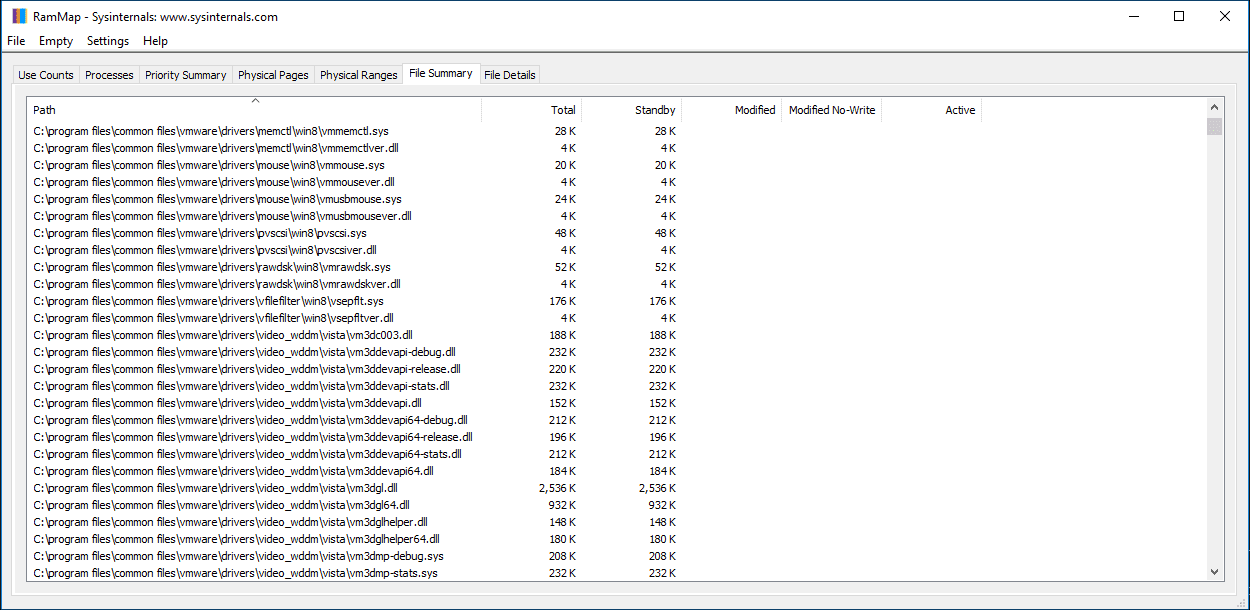
File-Level Cache Analysis
The File Summary tab reveals which files are cached in RAM, sorted by size. If your standby list is full, this tab tells you exactly which files are responsible.
Memory Clearing Options
Through the Empty menu, you can flush the working set, standby list, modified page list, or the combined file cache. This is particularly helpful when benchmarking or testing software under controlled conditions.
Snapshot Save and Load
Capture a snapshot of your system’s current memory state and save it to a file. You can reload that snapshot later or share it with a colleague for remote troubleshooting.
Real-Time Refresh
Hit F5 or use the File menu to refresh all tabs with live data. Memory allocation changes constantly, and RAMMap lets you watch those shifts as they happen.
Color-Coded Memory States
Active pages appear green, Standby in blue, Modified in yellow, and Bad memory in red. These visual cues make it easy to scan large datasets and quickly identify memory pressure at a glance.
Portable — No Installation
RAMMap runs directly from its ZIP archive. There is nothing to install and nothing written to the registry. Drop the executable on a USB drive and run it on any Windows machine you need to diagnose.
Ready to see what your RAM is really doing? Download RAMMap and start analyzing.
Getting Started with RAMMap
From download to your first memory analysis in under five minutes. Here is everything you need to start using RAMMap on your Windows PC.
Downloading RAMMap
Head to our download section above to grab the latest version of RAMMap. The download comes as a single ZIP file — RAMMap.zip — weighing in at just 706 KB. Even on a slow connection, you will have the file within seconds.
RAMMap is a portable application, which means there is no installer, no setup wizard, and no registry entries. The ZIP contains two executables: RAMMap.exe (64-bit) and RAMMap64a.exe (ARM64). If you are running a standard Windows desktop or laptop, go with RAMMap.exe. ARM64 users on Surface Pro X or similar devices should use the ARM variant instead.
There is no beta or unstable channel to worry about. Microsoft publishes one version at a time on the Sysinternals site, and version 1.62 (released February 2026) is the current stable build. You do not need to pick between editions or feature tiers — RAMMap is entirely free with no premium upsell.
Extraction and First Launch
RAMMap does not have an installer, so setup is just “extract and run.” Here is how to do it step by step:
- Right-click the downloaded RAMMap.zip and select Extract All (or use 7-Zip / WinRAR if you prefer). Pick a folder you will remember — something like
C:ToolsRAMMapworks well. - Open the extracted folder. You will see
RAMMap.exe,RAMMap64a.exe, aEula.txtfile, and a readme. - Right-click RAMMap.exe and choose Run as administrator. RAMMap needs admin privileges because it reads kernel-level memory data that regular user accounts cannot access.
- Accept the Sysinternals license agreement. On the first launch, a EULA dialog pops up. Click Agree to continue. This dialog only appears once.
After accepting the EULA, RAMMap opens directly to the Use Counts tab and immediately begins scanning your system memory. The scan typically finishes in 1-3 seconds on most hardware. No configuration wizard, no account creation — it just works.
If you want to run RAMMap from the command line (useful for automated scripts or scheduled tasks), open an elevated Command Prompt and navigate to the folder:
RAMMap.exe -accepteula
The -accepteula flag silently accepts the license agreement, which is useful for scripted or headless usage. You can also use -nobanner to suppress the Sysinternals banner if running from automation tools.
Understanding the Interface
RAMMap’s window has a classic Windows utility layout: a menu bar at the top (File, Empty, Options, Help), followed by a row of seven tabs. Each tab gives you a different view into how your physical memory is being used. Here is what each tab shows:
- Use Counts — The default view. A summary table breaking down total RAM by type (Process Private, Mapped File, Metafile, Paged Pool, Nonpaged Pool, Driver Locked, etc.) and by state (Active, Standby, Modified, Zeroed, Free). This is where you start.
- Processes — Lists every running process with its private working set, standby, and modified memory. Sort by any column to find which process is eating the most RAM.
- Priority Summary — Breaks the standby list into priority levels (0 through 7). When memory gets tight, Windows reclaims lower-priority pages first. This tab helps you understand what Windows would drop next.
- Physical Pages — Shows every individual 4 KB page in physical memory. This is the most granular view — great for low-level debugging, but most users will not need it day to day.
- Physical Ranges — Displays valid physical memory address ranges. Useful for identifying hardware-reserved memory blocks like GPU allocations.
- File Summary — Lists all files that currently have pages in RAM (DLLs, executables, data files). Sort by size to see which files consume the most physical memory.
- File Details — Expands on File Summary by showing the individual pages belonging to each file. Helpful when you need to know exactly which portions of a file are cached.
The color-coded bars in the Use Counts tab give you a quick visual read: green for Active memory (in use right now), blue for Standby (cached but reclaimable), yellow for Modified (changed but not yet written to disk), and red for Bad memory (hardware errors).
Your First Memory Analysis
Let’s walk through a real scenario: figuring out why your system feels sluggish even though Task Manager says “80% memory used.”
- Open RAMMap as administrator and look at the Use Counts tab. Check the Standby column — if it shows several gigabytes, that memory is file cache. Windows is using it to speed up disk reads, but it can reclaim this space the moment an application needs it. High standby is normal and actually good for performance.
- Switch to the Processes tab. Click the Total column header to sort processes by memory usage (descending). The top entries reveal which programs hold the most physical RAM. If a single process shows an unusually large working set — say, 4 GB or more — that may be a memory leak worth investigating.
- Check the File Summary tab. Sort by Total to see which files occupy the most RAM. You might discover that a large database file, a backup tool, or an antivirus engine is filling the file cache with data you do not need cached.
- Use the Empty menu to test. If you suspect standby cache is causing issues (rare, but possible on systems with limited RAM), go to Empty > Empty Standby List. This immediately frees all cached pages. Press F5 to refresh and compare before-and-after values.
Here are the Empty menu options and what each one does:
- Empty Working Sets — Moves all user and system process memory from Active to Standby/Modified. Applications will page-fault their data back in as needed.
- Empty System Working Set — Same concept, but only for the system file cache. Leaves application memory untouched.
- Empty Modified Page List — Forces Windows to write all modified (dirty) pages to disk. Good for testing how much memory is waiting to be flushed.
- Empty Standby List — Purges all standby (cached) pages. The most commonly used option when you want to see how much RAM is actually committed vs. just cached.
- Empty Priority 0 Standby List — Only clears the lowest-priority standby pages. A gentler alternative to emptying the entire standby list.
To save a snapshot of your current memory state for later comparison, go to File > Save and choose a location. You can reload snapshots with File > Open to compare memory usage across different time points or system configurations.
The key shortcuts you will use most often:
| Shortcut | Action |
|---|---|
| F5 | Refresh memory data |
| Ctrl + S | Save current snapshot |
| Ctrl + O | Open a saved snapshot |
| Ctrl + F | Find / search within the Physical Pages tab |
Tips and Best Practices
Do not confuse standby memory with a problem. One of the most common mistakes is seeing 12 GB of standby memory and thinking the system is out of RAM. Standby is cache — Windows actively uses it to make file access faster, and it gets released the moment an application requests more memory. High standby usage on a system with free memory is a sign everything is working correctly.
Use snapshots for before-and-after comparisons. If you are troubleshooting a memory leak, save a snapshot right after boot, then another after the suspected leak has been running for a while. Open both side-by-side (run two instances of RAMMap) to see exactly what grew.
Pair RAMMap with Process Explorer. RAMMap tells you how physical memory is allocated overall, but Process Explorer (also from Sysinternals) gives you deeper per-process details like handle counts, DLL lists, and GPU memory. The two tools complement each other well for serious troubleshooting.
Check the File Summary tab for antivirus bloat. Real-time antivirus scanners sometimes cache hundreds of megabytes of signature files in RAM. If your File Summary tab shows a large entry from your AV vendor, that is worth looking into — some AV products let you adjust cache sizes in their settings.
Automate with command-line flags. For IT admins managing multiple machines, RAMMap supports the -accepteula flag to skip the license dialog and can be launched directly from a network share. Combine it with PowerShell remoting to check memory usage across servers without opening an RDP session.
RAMMap does not have an auto-update feature since it is a standalone portable tool. To stay current, bookmark our download page or check the Sysinternals site periodically. Microsoft does not follow a fixed release schedule — updates come when there are bug fixes or new OS compatibility changes.
Ready to analyze your system memory? Download RAMMap and follow these steps to get started.
RAMMap in Action
See how RAMMap breaks down your system memory across its analysis tabs. Click any image for a closer look.
Screenshots captured from RAMMap v1.62 running on Windows 10/11
Frequently Asked Questions
Answers to the most common questions about downloading, using, and troubleshooting RAMMap on Windows.
Is RAMMap safe to download and use?
Yes, RAMMap is completely safe. It is developed by Mark Russinovich at Microsoft and distributed as part of the official Sysinternals suite. Microsoft signs the executable, and the download comes directly from download.sysinternals.com, which is Microsoft-owned infrastructure.
The RAMMap v1.62 ZIP file is just 706 KB and contains a clean, portable executable. Multiple antivirus engines on VirusTotal consistently return zero detections for the official download. RAMMap runs as a read-only analysis tool by default — it reads your memory state without modifying system files, registry entries, or startup configuration. The only write action it performs is when you explicitly choose one of the “Empty” menu options to flush a memory list.
- Download only from Microsoft’s official Sysinternals page or from our download section
- The ZIP contains RAMMap.exe (32-bit) and RAMMap64.exe (64-bit) — no installer, no bundled software
- No internet connection required after download — it works fully offline
- Does not install drivers, services, or background processes
Pro tip: If Windows SmartScreen shows a warning on first launch, right-click the EXE, go to Properties, and check “Unblock” at the bottom of the General tab. This happens because the file was downloaded from the internet, not because of any security issue.
For a full breakdown of what RAMMap does, see our features section.
Where is the official safe download for RAMMap?
The official RAMMap download is hosted on Microsoft’s Sysinternals page at learn.microsoft.com/en-us/sysinternals/downloads/rammap. The actual ZIP file downloads from download.sysinternals.com/files/RAMMap.zip, which is a Microsoft-controlled CDN.
A common mistake is downloading RAMMap from third-party software aggregator sites like Softonic, CNET Download, or random file-hosting mirrors. These repackaged versions sometimes bundle adware, browser toolbars, or modified installers that the original does not include. The official version is a plain ZIP with no installer at all — if you see an .exe installer wrapper, it is not the genuine Microsoft release.
- Go to the Microsoft Sysinternals downloads page or use our direct download link
- Verify the file size is approximately 706 KB (the ZIP) — significantly larger files suggest repackaging
- The ZIP should contain RAMMap.exe and RAMMap64.exe with no additional files except a EULA text
Pro tip: You can also get RAMMap through the Sysinternals Live service by navigating to live.sysinternals.com/RAMMap.exe in your browser or File Explorer. This always serves the latest version without needing to download a ZIP.
Check our Getting Started guide for step-by-step download and extraction instructions.
Does RAMMap work on Windows 11?
Yes, RAMMap v1.62 works on Windows 11 without any compatibility issues. It supports all Windows 11 builds including 23H2 and 24H2, running natively on both Intel/AMD and ARM-based processors through emulation.
RAMMap officially supports Windows Vista and every Windows release after it, including Windows 7, 8, 8.1, 10, and 11. On the server side, it runs on Windows Server 2008 and later. The tool reads physical memory information through standard Windows kernel APIs that have remained consistent across these versions, so there are no special compatibility patches or workarounds needed.
- Works on Windows 11 Home, Pro, Enterprise, and Education editions
- No installation required — extract and run RAMMap64.exe for 64-bit systems
- Requires administrator privileges to read physical memory data
- Compatible with Windows 11 on ARM devices (Surface Pro X, etc.) through x86 emulation
Pro tip: On Windows 11, right-click RAMMap64.exe and select “Run as administrator” for full access. Without admin rights, some memory categories will show incomplete data or zero values.
See our system requirements for the complete compatibility list.
Does RAMMap work on macOS or Linux?
No, RAMMap is a Windows-only utility. It relies on Windows kernel APIs for physical memory analysis, so there is no macOS or Linux version and Microsoft has not announced plans to port it.
RAMMap uses the Windows Memory Manager APIs to query physical page frame data, standby lists, working sets, and driver-locked memory. These APIs exist only on the Windows NT kernel, making a direct port impossible. Mark Russinovich built the Sysinternals suite specifically for Windows internals analysis, and that scope has not changed since the tools joined Microsoft in 2006.
- macOS alternative: Use Activity Monitor (built-in) for basic memory stats, or
vm_statandmemory_pressurein Terminal for detailed breakdowns - Linux alternative: Use
/proc/meminfo,free -h,vmstat, orsmemfor per-process physical memory reporting - Cross-platform option: Process Hacker (Windows) or htop (Linux/macOS) for general memory monitoring
Pro tip: If you need RAMMap on a Mac, you can run it inside a Windows virtual machine using Parallels Desktop, VMware Fusion, or UTM. The VM’s memory will be analyzed rather than the host Mac’s memory, but this still works for testing and learning.
For Windows users, head to our download section to get RAMMap v1.62.
What are the system requirements for RAMMap?
RAMMap has minimal system requirements: any Windows PC from Vista onward with at least 512 MB of RAM can run it. The tool itself uses very little memory and disk space.
The RAMMap ZIP download is 706 KB, and the extracted executables total under 2 MB. When running, RAMMap typically uses 15-40 MB of RAM depending on how much physical memory your system has and which tabs you have open. The Physical Pages tab on a 32 GB system can push usage higher (around 80-100 MB) because it maps every individual page. CPU usage stays near zero except during refresh operations.
- OS: Windows Vista, 7, 8, 8.1, 10, or 11 (any edition). Windows Server 2008 and later.
- CPU: Any x86 or x64 processor. ARM through emulation on Windows 11.
- RAM: No practical minimum beyond what Windows itself requires (512 MB+)
- Disk: Under 2 MB for the extracted files. No installation writes to disk.
- Permissions: Administrator rights required for full memory analysis
Pro tip: If you are analyzing a server with 128 GB or more RAM, avoid opening the Physical Pages tab unless you have a specific reason. It enumerates every single physical page, which can take 30-60 seconds and temporarily spike RAMMap’s own memory use to 500+ MB.
View the full requirements table on our system requirements page.
Is RAMMap completely free to download and use?
Yes, RAMMap is 100% free. There is no paid version, no premium tier, no trial period, and no feature restrictions. You get the full tool at zero cost.
RAMMap is part of the Sysinternals suite, which Microsoft has offered for free since acquiring the tools from Winternals Software in 2006. The suite includes over 70 utilities (Process Explorer, Process Monitor, Autoruns, and others), all distributed at no charge. RAMMap is licensed under the Microsoft Sysinternals Software License Terms, which permit free use for personal, educational, and commercial purposes. There is no registration, no account creation, and no telemetry reporting.
- Free for personal, business, and enterprise use
- No ads, no bundled software, no upsell prompts
- No sign-up or Microsoft account required
- Redistributable within the terms of the Sysinternals license (you can share the ZIP freely)
Pro tip: IT administrators who need multiple Sysinternals tools can download the entire suite as a single ZIP (about 45 MB) from the Sysinternals download page, rather than grabbing each utility individually.
Grab your free copy from our download section.
Can I use RAMMap in a corporate or enterprise environment?
Yes, RAMMap is licensed for corporate and enterprise use at no cost. The Sysinternals license allows deployment across business workstations and servers without purchasing separate licenses.
Many IT departments and system administrators rely on Sysinternals tools as standard diagnostic utilities. RAMMap is particularly useful on production servers where you need to understand physical memory allocation without installing monitoring agents. Since it is portable (no installation), it does not conflict with change management policies that restrict software installations on managed endpoints. Microsoft’s own support engineers use Sysinternals tools during escalated support cases.
- Deploy to any number of machines without per-seat licensing
- Portable format means no registry changes, no services installed, no Group Policy conflicts
- Can be placed on a network share and run directly from there
- Compatible with application whitelisting tools like AppLocker and WDAC when properly configured
Pro tip: Place RAMMap on a shared network drive at \servertoolssysinternals or use the Sysinternals Live path (\live.sysinternals.comtools) to always access the latest version without manual updates across your fleet.
Learn more about RAMMap’s capabilities in our features overview.
How do I download and set up RAMMap step by step?
RAMMap requires no installation. You download a ZIP file, extract it, and run the executable directly. The entire process takes under a minute.
Because RAMMap is a portable application, it does not write to your registry, create Start Menu shortcuts, or add background services. You can run it from any folder, including a USB drive or a network share. The ZIP file is 706 KB and extracts to under 2 MB. Both 32-bit (RAMMap.exe) and 64-bit (RAMMap64.exe) versions are included in the same archive.
- Download RAMMap.zip from our download section or the official Microsoft Sysinternals page
- Right-click the ZIP file and select “Extract All” (or use 7-Zip, WinRAR, etc.)
- Open the extracted folder and find RAMMap64.exe (for 64-bit Windows, which covers most modern PCs)
- Right-click RAMMap64.exe, select “Run as administrator” — this is required for full memory data
- Accept the Sysinternals license agreement on first launch (one-time prompt)
- RAMMap opens showing the Use Counts tab with your current physical memory breakdown
Pro tip: Pin the extracted folder to Quick Access in File Explorer or create a desktop shortcut to RAMMap64.exe. To always run as admin, right-click the shortcut, go to Properties > Advanced, and check “Run as administrator.”
For more detailed guidance, visit our Getting Started section.
Is RAMMap portable or does it need installation?
RAMMap is fully portable. There is no installer, no setup wizard, and no installation process. You extract the ZIP and run the EXE directly.
This makes RAMMap ideal for USB toolkit drives, network diagnostic shares, and locked-down corporate machines where software installation is restricted. It writes nothing to the Windows registry, creates no folders in Program Files or AppData, and leaves no trace on the system after you close it. The only file RAMMap creates is an optional memory snapshot (.rmm file) if you save one through File > Save.
- The ZIP contains RAMMap.exe (32-bit, ~380 KB) and RAMMap64.exe (64-bit, ~530 KB)
- Run from any location: desktop, Downloads folder, USB drive, network share
- No system modifications — no services, no drivers, no scheduled tasks
- Delete the folder to “uninstall” — nothing else to clean up
Pro tip: System administrators can host RAMMap on a network share or use Microsoft’s Sysinternals Live service (\live.sysinternals.comtoolsRAMMap64.exe) to run it without even downloading a file. Just type that UNC path into File Explorer’s address bar.
Download the portable ZIP from our download section.
RAMMap shows “Not Responding” after emptying standby list — how to fix?
This is normal behavior, not a crash. After you select Empty > Empty Standby List, RAMMap needs to re-scan the entire physical memory state, which can take 30-60 seconds on systems with 16 GB or more RAM. During this re-scan, Windows may show the “Not Responding” label in the title bar.
When you empty the standby list, Windows moves all cached pages from the Standby list to the Free list. RAMMap then has to enumerate every physical page frame again to update its display. On a 32 GB machine, that means scanning millions of page entries. The tool has not frozen — it is processing. The “Not Responding” text appears because Windows marks any application that stops processing window messages for more than 5 seconds as unresponsive.
- Wait 30-60 seconds — RAMMap will come back and show the updated memory state
- Alternatively, close RAMMap immediately after using the Empty menu, then reopen it for a fresh view
- On servers with 64 GB+ RAM, the re-scan can take up to 2 minutes. Be patient.
- Do not click inside the RAMMap window during the scan — this can trigger additional “Not Responding” prompts from Windows
Pro tip: If you regularly need to clear the standby list without the GUI delay, use the command-line EmptyStandbyList.exe tool (a separate Sysinternals-community utility) or run RAMMap64.exe -Et to empty and close in one step.
For more on the Empty menu options, check our features overview.
Why does my standby memory keep filling back up after I clear it?
That is exactly how Windows memory management works. The standby list refilling is not a bug — it is the operating system using free RAM productively by caching recently accessed file data for faster retrieval.
Windows treats unused physical memory as wasted memory. When you read files, launch programs, or browse the web, the OS keeps that data in the standby list so it can serve it again quickly without reading from the slower SSD or hard drive. If an application needs more RAM, Windows instantly discards standby pages to free space. The system is designed to keep the standby list as full as possible. Emptying it with RAMMap forces the OS to reload everything from disk the next time you access those files, which actually slows things down temporarily.
- High standby memory (even 70-80% of total RAM) is normal and healthy on an idle Windows system
- Windows automatically releases standby pages when applications request more memory
- Clearing the standby list repeatedly hurts performance by forcing more disk reads
- The only time manual clearing helps is when a specific driver or app bug prevents Windows from reclaiming standby pages under pressure (rare, usually fixed by driver updates)
Pro tip: Instead of emptying the standby list, use RAMMap’s Processes tab to identify which process is actually consuming the most active (committed) memory. That is usually the real culprit behind sluggishness, not standby cache.
Learn how to read the Use Counts tab properly in our Getting Started guide.
How to fix RAMMap not opening or showing a blank white window?
A blank or white RAMMap window usually means the EXE is blocked by Windows security or your antivirus. The fix takes about 30 seconds.
When you download files from the internet, Windows adds an “Alternate Data Stream” (ADS) mark-of-the-web flag that can cause applications to run in a restricted mode. Some antivirus programs (especially Kaspersky, Bitdefender, and Avast) may also sandbox or block Sysinternals tools because they access low-level kernel memory data. Additionally, running RAMMap without administrator privileges will result in missing data or a stalled interface.
- Right-click the RAMMap64.exe file, select Properties, and check “Unblock” on the General tab. Click Apply.
- Right-click RAMMap64.exe again and select “Run as administrator” — the tool needs elevated privileges
- If your antivirus blocks it, add an exclusion for the RAMMap folder in your AV settings
- Try downloading a fresh copy directly from Microsoft’s Sysinternals page — older versions may have bugs on newer Windows builds
- On Windows 11, make sure you are running RAMMap64.exe (not the 32-bit RAMMap.exe)
Pro tip: If none of these work, try running RAMMap from an elevated Command Prompt: open cmd as admin, navigate to the RAMMap folder, and type RAMMap64.exe. Any error messages will appear in the console window, making the issue easier to diagnose.
For download and extraction steps, see our Getting Started section.
How do I update RAMMap to the latest version?
RAMMap does not have an auto-update feature. To update, download the latest ZIP from the official Sysinternals page and replace your existing files. The current version is 1.62, released on February 4, 2026.
Because RAMMap is portable, updating is straightforward: download the new ZIP, extract it to the same folder (overwriting the old files), and you are done. There are no settings to migrate, no profiles to back up, and no databases to convert. Your saved .rmm snapshot files remain compatible across versions. Sysinternals tools do not follow a regular release schedule; updates happen when Microsoft addresses bugs or adds features, which can be months or years apart.
- Check the current version by opening RAMMap and clicking Help > About
- Visit the download section or the Microsoft Sysinternals page to see the latest version number
- Download the new RAMMap.zip if a newer version is available
- Extract and overwrite the files in your existing RAMMap folder
- Delete any old shortcuts and create new ones if needed
Pro tip: Subscribe to the Sysinternals Blog RSS feed or follow @MarkRussinovich on Twitter/X for update announcements. You can also use the Sysinternals Live path (\live.sysinternals.comtools) which always serves the latest version automatically.
Get the latest version from our download page.
What changed in the latest version of RAMMap?
RAMMap v1.62 (released February 4, 2026) includes bug fixes, improved compatibility with recent Windows 11 builds, and refinements to how memory categories are reported in the Use Counts tab.
Microsoft does not publish detailed changelogs for individual Sysinternals tools the way most commercial software does. Updates typically address compatibility with new Windows kernel changes, fix display bugs in memory reporting, and improve stability on systems with very large amounts of RAM (64 GB+). Previous notable updates include v1.61 which fixed memory category reporting on Windows Server 2022, and v1.60 which added improved support for large page sizes.
- Check the version number through Help > About inside RAMMap
- The Sysinternals Blog at
techcommunity.microsoft.comoccasionally announces major updates - Older versions remain functional on their supported OS versions but may misreport certain memory categories on newer Windows builds
Pro tip: If you work in IT and need to audit which RAMMap version your team is running, the EXE file properties (right-click > Properties > Details tab) show the exact version number, which you can query remotely via PowerShell: Get-Item \servertoolsRAMMap64.exe | Select VersionInfo.
Download the latest v1.62 from our download section.
RAMMap vs Resource Monitor — which should I use?
RAMMap and Resource Monitor serve different purposes. Resource Monitor shows real-time per-process memory usage, while RAMMap shows how Windows allocates physical memory at the hardware level. Use both together for a complete picture.
Resource Monitor (built into Windows since Vista, accessible via resmon.exe) excels at showing you which process is using how much committed, working set, shareable, and private memory in real time. It also monitors CPU, disk, and network per-process. RAMMap goes deeper: it shows physical page-level allocation broken down by type (Active, Standby, Modified, Zeroed, Free), which no other built-in Windows tool reveals. This distinction matters when diagnosing standby list issues, metafile bloat, driver-locked memory, or non-paged pool growth.
- Use Resource Monitor when: You need to find which process is consuming the most RAM right now, or track real-time memory changes
- Use RAMMap when: Task Manager shows high memory usage but processes do not add up, or you need to investigate standby cache, metafile, or kernel pool usage
- Use both when: Troubleshooting a suspected memory leak — Resource Monitor identifies the process, RAMMap shows where the physical pages went
Pro tip: A frequent scenario: Task Manager reports 90% RAM usage but process totals only reach 60%. Open RAMMap and check the Metafile and Mapped File rows in Use Counts — file server workloads, antivirus, and Windows Search often fill these categories invisibly.
See what makes RAMMap unique in our features section.
RAMMap vs Process Explorer — what is the difference?
Process Explorer focuses on processes and their resource usage, while RAMMap focuses on physical memory allocation system-wide. They are complementary tools from the same Sysinternals suite, not replacements for each other.
Process Explorer (also by Mark Russinovich) is an advanced Task Manager replacement that shows process trees, DLL loading, handle lists, GPU usage, and per-process memory details including private bytes, working set, and virtual size. It answers “what is this process doing?” RAMMap answers “where did all my physical RAM go?” by categorizing every page of physical memory into types like Process Private, Mapped File, Metafile, Paged Pool, Nonpaged Pool, Driver Locked, and more. You cannot get this system-wide physical memory breakdown from Process Explorer.
- Process Explorer strengths: Process tree view, DLL inspection, handle search, VirusTotal integration, real-time GPU/CPU/disk per process
- RAMMap strengths: Physical page-level analysis, standby list management, file-to-RAM mapping, priority summary, snapshot comparison
- Overlap: Both show per-process working set sizes, but RAMMap adds the physical memory context that Process Explorer lacks
Pro tip: For a thorough memory investigation, run Process Explorer to identify the suspicious process, then switch to RAMMap’s File Summary tab to see which files that process has cached in physical memory. This two-tool workflow is what Microsoft’s own support engineers recommend in escalation guides.
Explore RAMMap’s unique analysis capabilities on our features page.
What do the different Empty menu options in RAMMap actually do?
RAMMap’s Empty menu has five options, each targeting a different memory list. They let you manually flush cached or buffered memory for testing and troubleshooting. Most users only need “Empty Standby List” and should leave the others alone.
These options interact directly with the Windows Memory Manager. They are designed for diagnostics, not daily maintenance. Using them aggressively or on a schedule can hurt performance because Windows has to rebuild cache from scratch. Here is what each one does:
- Empty Working Sets: Trims the active working set of every running process, pushing pages to the Standby or Modified lists. Applications will briefly slow down as they fault pages back in. Useful for testing cold-start behavior.
- Empty System Working Set: Trims the system cache working set only. Rarely needed. Affects file system cache performance.
- Empty Modified Page List: Forces all dirty (modified) pages to be written to the pagefile or their backing files on disk, then moves them to Standby. Can cause a brief I/O spike on busy systems.
- Empty Standby List: Clears all standby (cached) pages, moving them to the Free list. The most commonly used option. Temporarily frees RAM but destroys useful cache.
- Empty Priority 0 Standby List: Clears only the lowest-priority standby pages, preserving higher-priority cache. A gentler alternative to nuking the entire standby list.
Pro tip: Try “Empty Priority 0 Standby List” first instead of clearing everything. It removes the least useful cached data while keeping frequently accessed files in memory. This is often enough to resolve stuttering in games without the disk I/O penalty of a full standby flush.
For a walkthrough of each tab and menu, see our Getting Started guide.
How do I save and compare memory snapshots in RAMMap?
RAMMap can save your current physical memory state to a .rmm snapshot file through File > Save. You can later open that file to review historical memory data or compare it side-by-side with a live scan.
Snapshots capture everything RAMMap displays: Use Counts totals, per-process working sets, file summary data, priority distributions, and physical page maps. The snapshot file size depends on your total RAM — expect roughly 5-15 MB for a 16 GB system and 20-40 MB for a 64 GB system. Snapshots are useful when you suspect a memory leak that builds over hours or days: take a snapshot when the system is healthy, take another when it starts misbehaving, and compare the two.
- Click File > Save to create a snapshot of the current memory state
- Choose a filename with a timestamp (e.g.,
rammap-2026-03-08-baseline.rmm) for easy identification - When you want to compare, open the old snapshot via File > Open, then launch a second RAMMap instance showing live data
- Place both windows side by side and compare Use Counts, Processes, or File Summary tabs
- Look for significant growth in Process Private, Metafile, Driver Locked, or Nonpaged Pool between snapshots
Pro tip: Set up a Task Scheduler job that runs RAMMap64.exe -Ss snapshot_%date%.rmm every few hours on production servers. This gives you a timeline of memory states to review when troubleshooting intermittent memory pressure issues after the fact.
Learn more about RAMMap’s analysis capabilities in our features section.
Still have questions? Check our Getting Started guide or visit the download section to get RAMMap v1.62.